
What Customer Demographic Data You Have and How to Use It
What Customer Demographic Data You Have and How to Use It
What Is This?
Pixalink collects basic demographic data on every customer — gender, date of birth, joined date, and outlet. You can filter, view, and export this data today. Full gender-split charts are not built in yet, so this article shows you what's possible now and how to get deeper insights.
Real-Life Example
Aishah runs a cafe in Bangsar. She wants to run a Mother's Day promotion but doesn't know how many of her 1,200 customers are women. She opens her customer list, turns on the Gender filter, and picks Female — the count updates instantly. She then exports that filtered list to a CSV file and drops it into Google Sheets. In under ten minutes she has 740 qualifying customers, knows 35% were born in April or May, and launches a targeted WhatsApp broadcast. Two weeks later, her Mother's Day special pulls in 3x the usual foot traffic.
What Demographic Data Pixalink Collects
Every customer record can hold:
- Name — full name
- Gender — Male or Female
- Date of Birth — full date, used to calculate age and birthday month
- Joined at — when the customer first signed up
- Outlet (Space) — which branch they first registered with
- Source — how the customer joined (Direct, WhatsApp, QR Code, import, etc.)
- Tags — any labels you or your team added
Gender and Date of Birth are optional on the registration form. If customers skip them, that row stays blank in your data.
How to See Demographics in Your Customer List
-
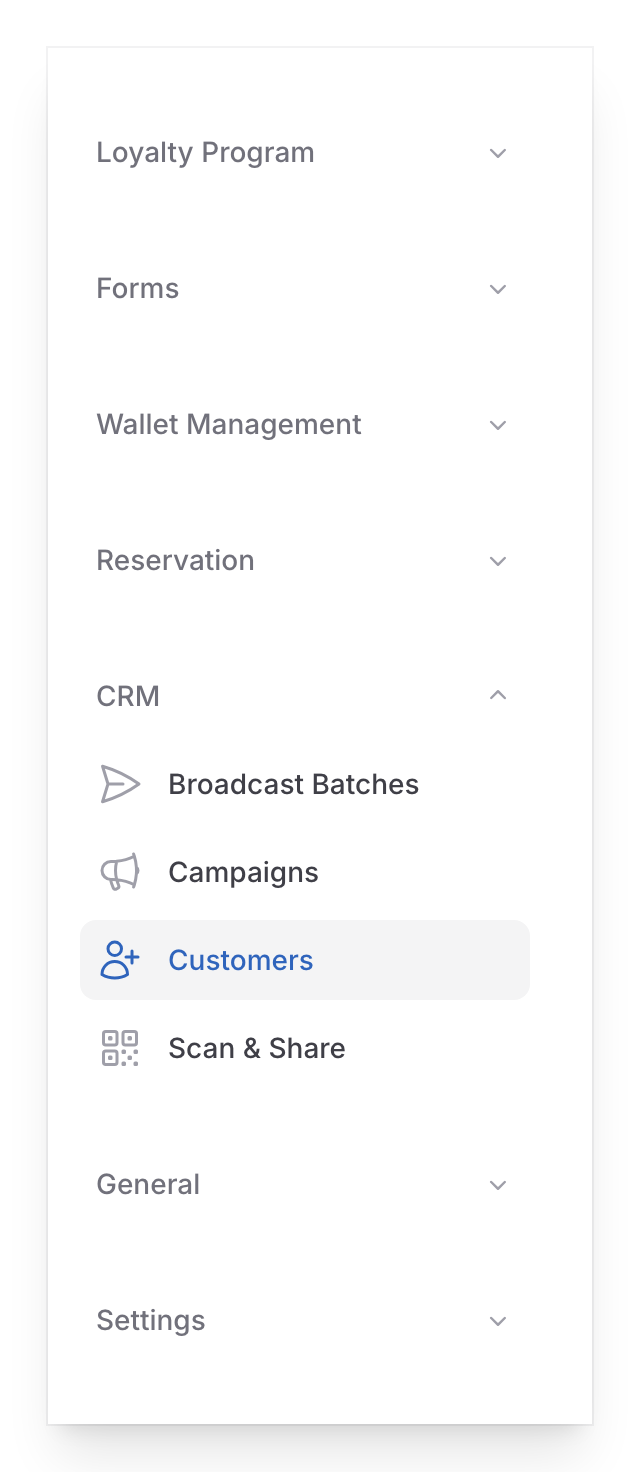
Go to Admin Panel → CRM → Customers
-
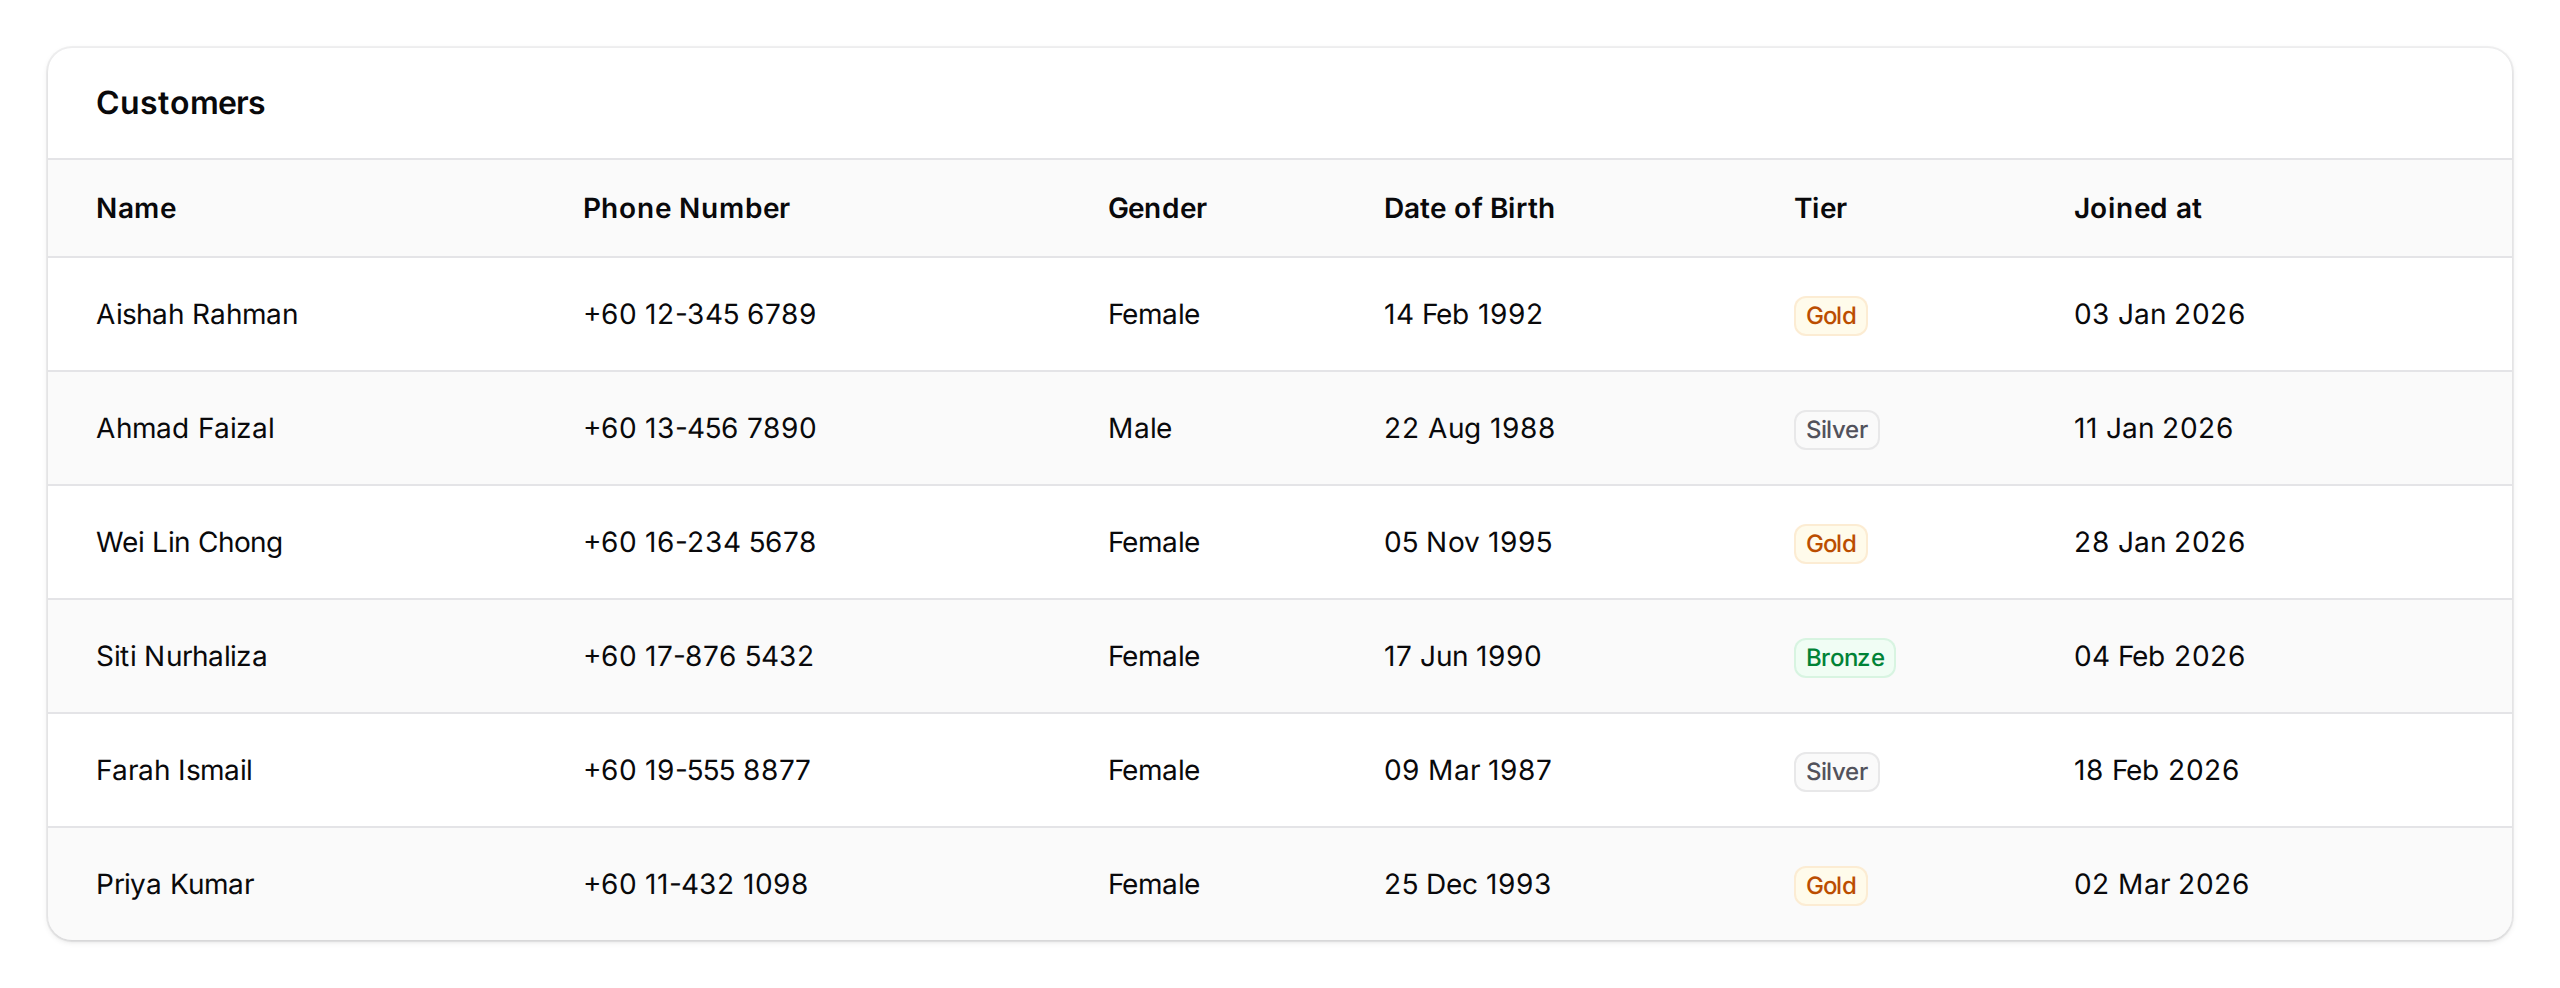
Click the column toggle icon above the table and turn on Gender and Date of Birth. These columns are hidden by default to keep the table clean
-
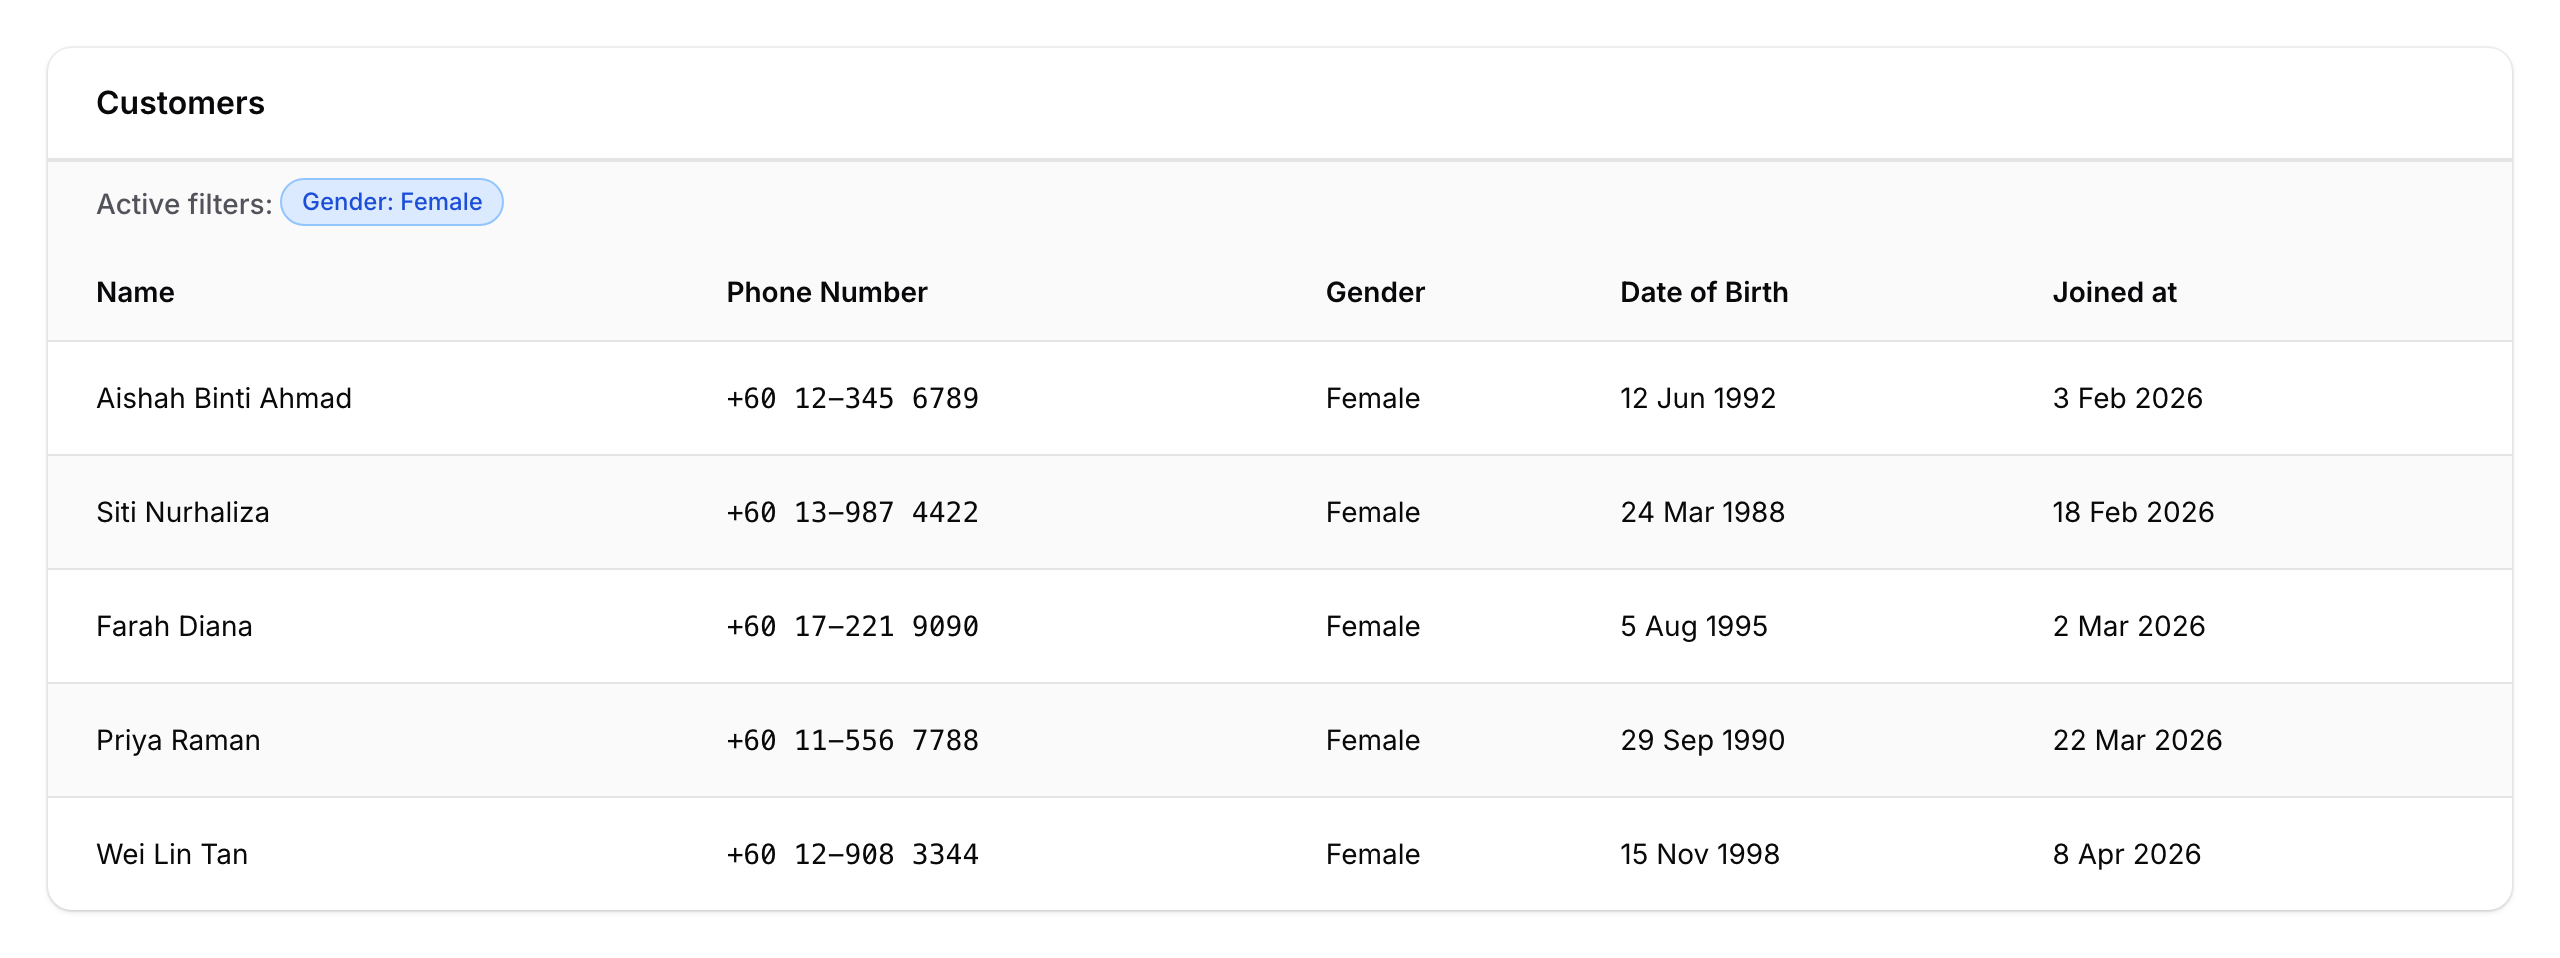
Click the Filters button to narrow the list by Gender or Birthday Month. The row count at the bottom updates to show how many customers match
-
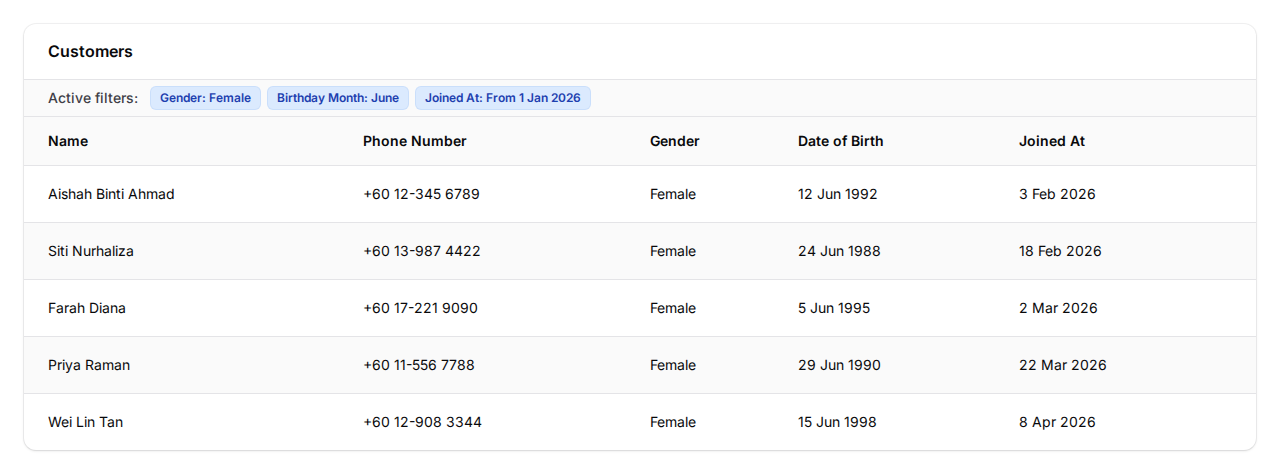
Combine filters to find highly specific groups — for example, all female customers born in June who joined after January this year
Native Analytics You Have Today
Your dashboard shows up to five stat cards out of the box:
- New Customers — how many joined this month, with a trend arrow against last month
- Pending Reservations — bookings waiting for your approval (shows only if you have reservations set up)
- Active Members — customers who made a transaction in the last 30 days
- Points Redeemed — total points your customers redeemed this month
- Total Reservation — past reservations (status: reserved, scheduled for today or earlier) (shows only if you have reservations set up)
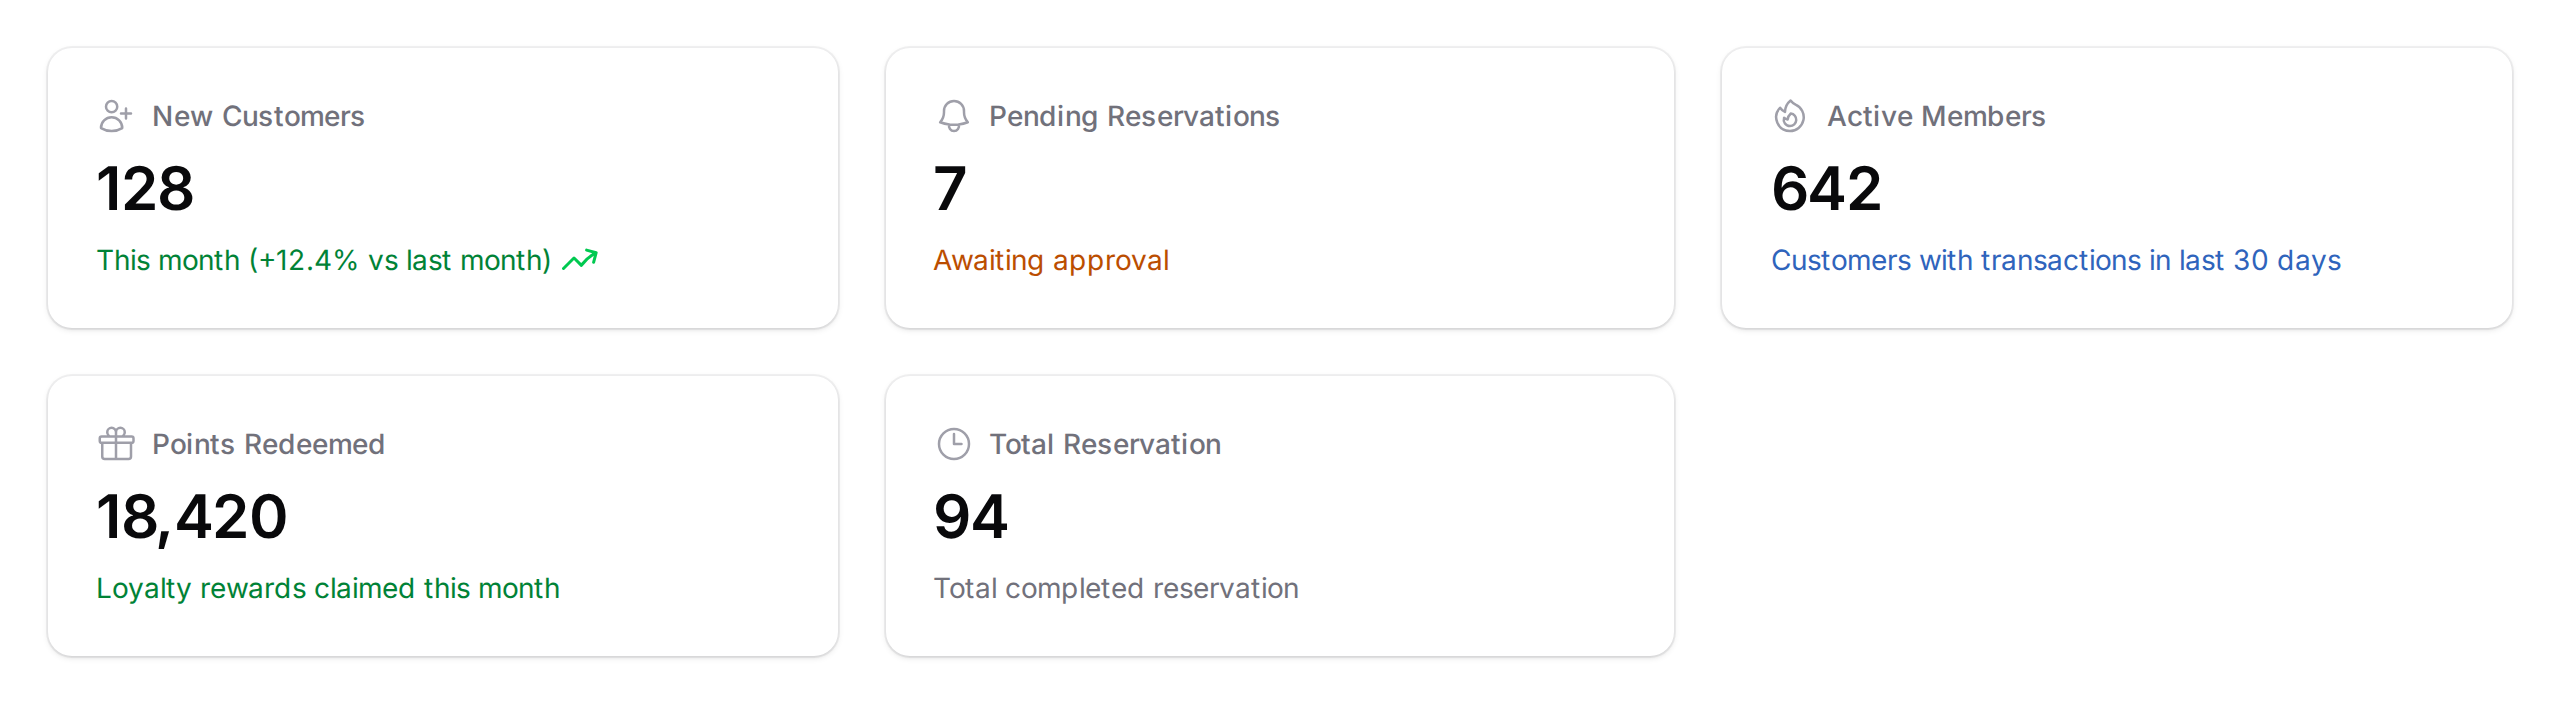
Pixalink does not currently show a gender split chart, age breakdown, or location heat map inside the admin panel. For those views, export your data and analyse it in Excel or Google Sheets.
How to Export and Analyse in Excel
-
On the Customers page, click Actions → Export
-
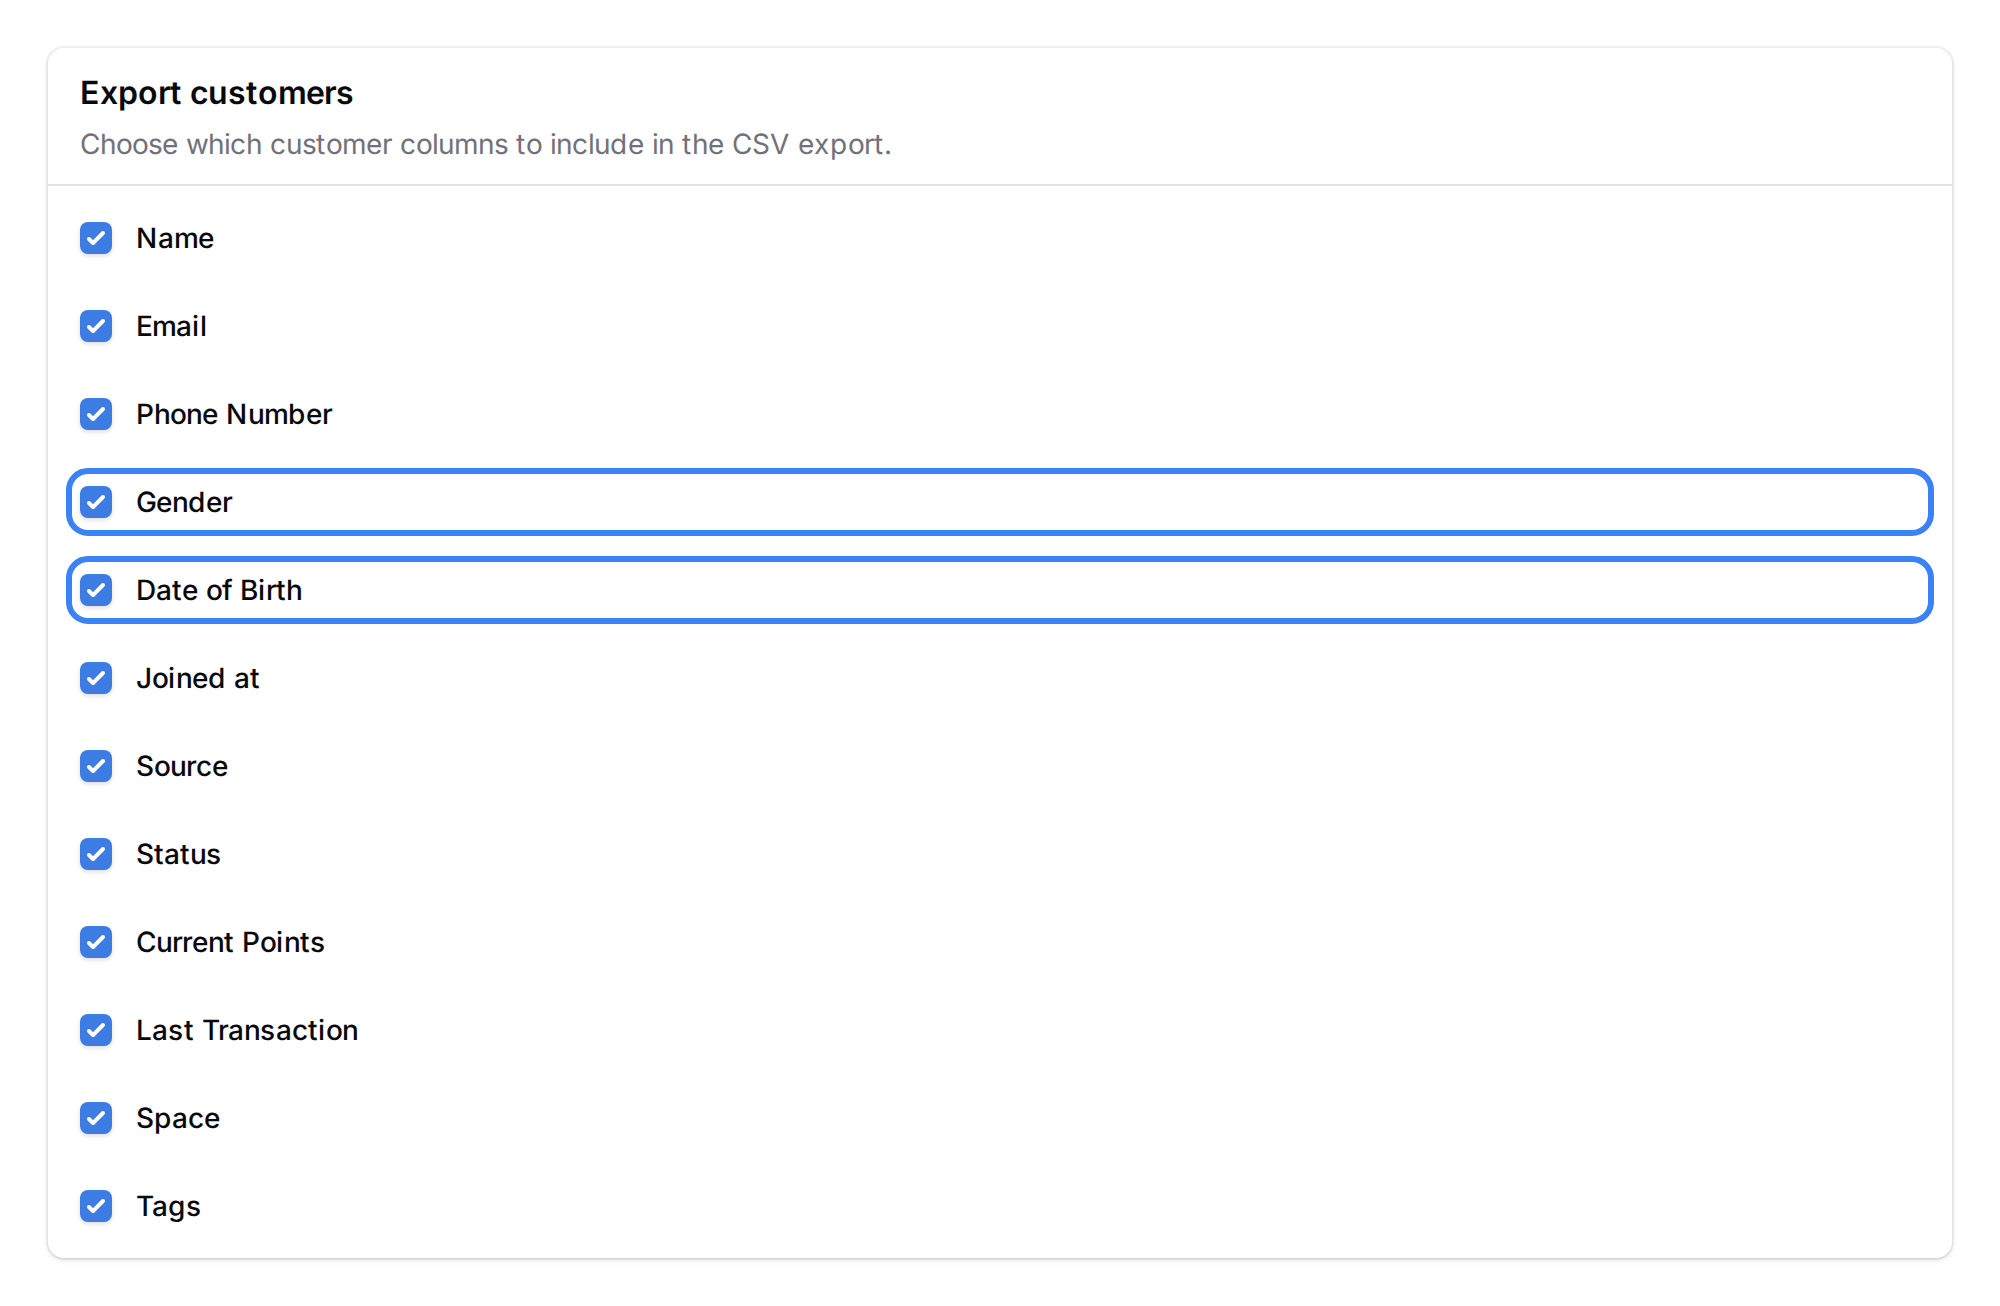
Tick the columns you want — you can choose to include Gender and Date of Birth in the export
-
Click Export — you'll get an email with the CSV file once it's ready
-
Open the file in Excel or Google Sheets. From there you can:
- Use a pivot table to count customers by Gender
- Use the
=YEAR(TODAY()) - YEAR(B2)formula to calculate age from Date of Birth - Group ages into buckets (18-24, 25-34, 35-44, 45+) with an IF formula
- Filter by Joined at date to see demographic shifts over time
How to Request a Custom Report
If you need something the admin panel doesn't give you — age-bracket breakdowns, outlet-by-outlet gender split, spending patterns by demographic — reach out to the Pixalink team.
- Send your request to our support team with: what you want to know, what decision it will help you make, and the time range
- Standard turnaround is 3 to 5 working days
- Most demographic reports are free for active Pixalink plans
Good to Know
- Gender and Date of Birth are optional fields. Encourage customers to fill them in by offering a small birthday reward — it often lifts completion rates by 40% or more
- The Birthday Month filter makes it easy to preview your monthly birthday audience before launching a campaign
- Data you add through POS integrations (Storehub, Loyverse, Shopify) may not include gender or date of birth. Those fields need to be filled in manually or through the customer portal
- Exports respect the filters on your customer list — so you can export only female customers, or only those born in June, and keep the file small
Need Help?
Reach out to our support team — we're happy to help you set up filters, export your data, or scope a custom report.
What's Next?
- How to Export Customer Data (link to be added once article is published)
- How to Send a Broadcast Campaign (link to be added once article is published)
- Customer Custom Fields Configuration (link to be added once article is published)