Understanding Your Reward Report
What Is This?
The Reward Report is a dedicated analytics page that shows everything about how your rewards are performing — which rewards are most popular, how many are being redeemed, distribution trends, and usage patterns. It helps you understand which rewards drive customer engagement and which might need adjusting.
Real-Life Example
Encik Danish runs GameZone Arcade in Mid Valley. He notices from the Reward Report that his "Free Game Token" reward has a 90% redemption rate, but the "10% F&B Discount" only has 20%. He decides to increase the F&B discount to 25% and reduce the points required — the report helps him optimise his reward strategy.
How to Access the Reward Report
Open the Analytics panel and navigate to the Rewards report page.
What You'll See
Reward Statistics
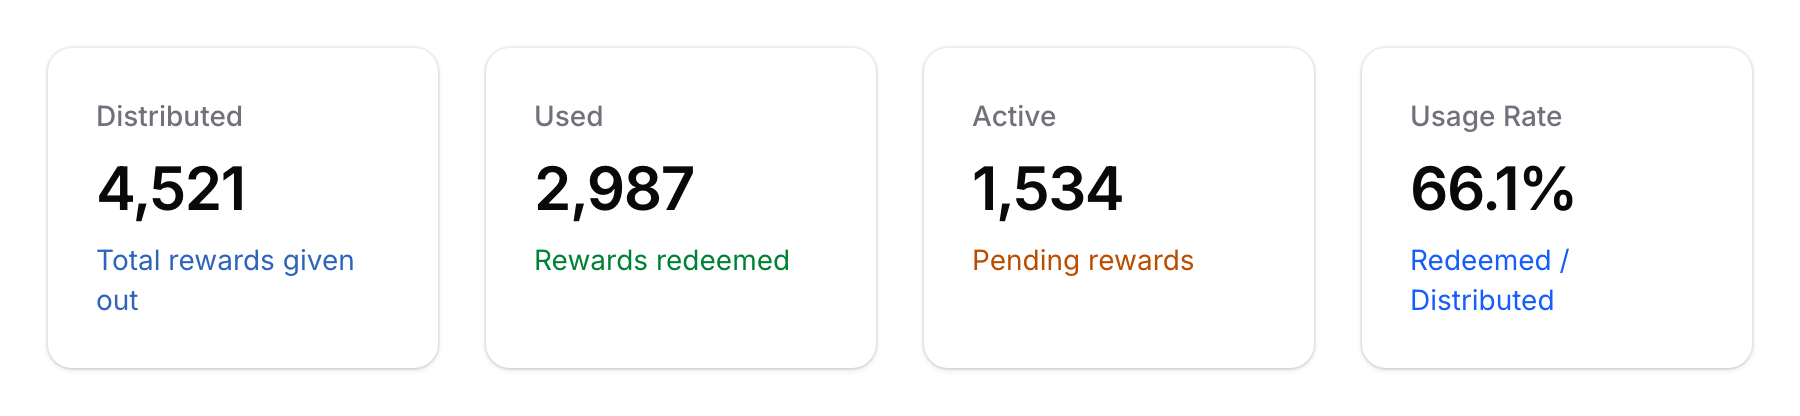
Key metrics displayed at the top:
- Total rewards distributed
- Total rewards used
- Active (pending) rewards
- Usage rate
Charts
| Chart | What It Shows |
|---|---|
| Rewards Usage Trend | How reward usage changes over time (weekly/monthly) |
| Redemption Trend | The rate at which customers are redeeming rewards |
| Specific Rewards Usage | Performance breakdown per individual reward |
| Customer Reward Status | Distribution of statuses: Pending, Redeemed, Expired, etc. |
| Rewards Distributed | Volume of each reward that has been given out |
Filtering
- Date Range — Focus on a specific period to track campaign effects
- Space — View reward performance by outlet
Good to Know
- High redemption rate = good reward — Rewards with high redemption rates are valuable to customers. Low rates might mean the reward isn't attractive enough or costs too many points.
- Watch for expired rewards — A high number of expired rewards suggests customers are either not aware of them or not motivated to redeem.
- Compare before and after — Use date filters to compare reward performance before and after making changes (e.g., adjusting points required).
- Seasonal patterns — Some rewards may perform better during holidays or specific seasons. Use the trend charts to spot these patterns.