Navigating Your Analytics Dashboard
What Is This?
The Analytics Dashboard gives you a bird's-eye view of your loyalty programme's performance. It shows key metrics like customer signups, reward usage, and engagement trends — all in one place. Use it to understand what's working, spot trends, and make data-driven decisions.
Real-Life Example
Puan Kamala manages Spice Route Restaurant chain across three outlets in KL. Every Monday morning, she opens the Analytics Dashboard to review last week's numbers — how many new customers signed up, which rewards are most popular, and whether the birthday campaign is driving visits. The charts help her present performance updates to the business owner.
How to Access the Dashboard
The Analytics Dashboard is in a separate panel from the Admin Panel. Look for the Analytics panel in your navigation or switch panels using the panel selector.
What You'll See
Overview Statistics
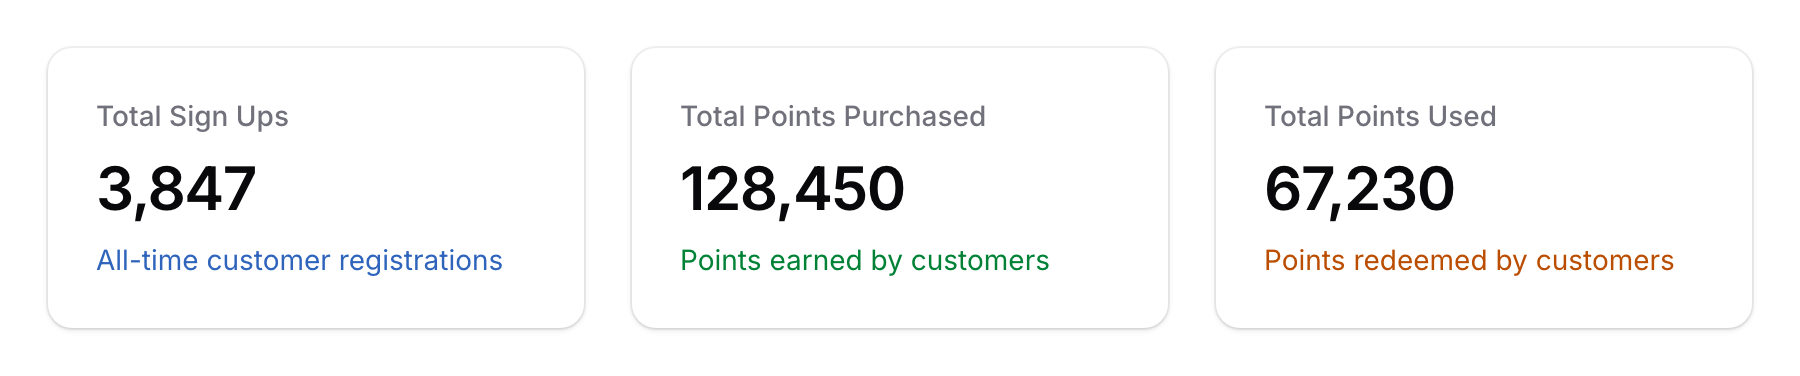
The main dashboard shows key stats at a glance:
Points Overview:
- Total Sign Ups
- Total Points Purchased (earned)
- Total Points Used (redeemed)
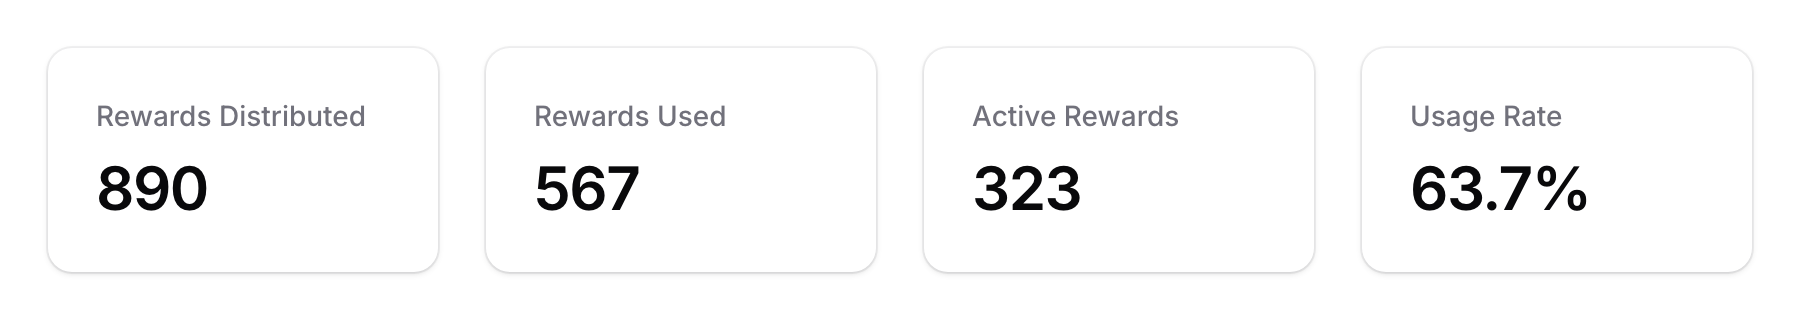
Rewards Overview:
- Total Rewards Distributed
- Total Rewards Used
- Active (Pending) Rewards
- Usage Rate
Charts and Trends
| Chart | What It Shows |
|---|---|
| Signup Chart | New customer registrations over time |
| Rewards Usage Trend | How often rewards are being redeemed |
| Customer Reward Status | Breakdown of reward statuses (pending, redeemed, expired) |
| Rewards Distributed | Which rewards are being given out most |
Filtering
Use the filter panel to narrow your view:
- Date range — Focus on a specific period
- Space — View analytics for a specific outlet
Specialised Reports
Beyond the main dashboard, the Analytics panel has dedicated report pages:
| Report | What It Covers | Link |
|---|---|---|
| Points Report | Points earned and redeemed trends | Understanding Your Point Report |
| Rewards Report | Reward distribution, redemption, and usage trends | Understanding Your Reward Report |
| Customer Report | Demographics, signup trends, login frequency | Understanding Your Customer Report |
Good to Know
- Real-time data — Dashboard data updates in real-time as transactions happen.
- Date filtering — Always check the date range filter. The default view may show all-time data, which can be adjusted to focus on a specific period.
- Multiple outlets — If you have multiple spaces, you can view combined or per-space analytics.
- Export — Some charts allow you to export data for further analysis in spreadsheets.
- Mobile friendly — The dashboard is responsive and works on tablets and phones.